- March 6, 2024
- Posted by: David Marshall
- Category: Management, Productivity

According to the Pareto Principle (also called the 80/20 rule), you’re wasting a large portion of your time on items and customers that don’t actually have an ROI for you.
That is, 20% of your customers bring in 80% of your results, and 20% of your inventory brings in 80% of your sales. Conversely, 80% of your customers and inventory bring in 20% of your sales.
And if you could just see what the top 20% were, you could save yourself a lot of time and make a lot more money.
Of course, there’s a way to figure out what that 20% is and that starts with an ABC analysis.
One year, in one of the plants I oversaw with Robroy, we performed an ABC analysis on the entire catalog.
What is an ABC Analysis?
In inventory management, an ABC analysis prioritizes items based on their significance to your business. It segments inventory into three categories: A, B, and C.
- Category A are the high-value items — the cream of the crop. These products drive a large portion of revenue or have strategic importance to your business.
- Category B are the moderately important items. They may not have the same clout as the Category A items, they still contribute to your bottom line.
- Category C comprises items of lesser impact/value. These are the background players that don’t influence revenue or operational efficiency.
Category C, on the other hand, comprises items of lesser value or impact. These are the background players that, while necessary for a comprehensive inventory, do not significantly influence revenue or operational efficiency.
By categorizing your inventory in this way, you can see where you should allocate your resources, prioritize your management efforts, and maintain optimal inventory levels.
How we did our ABC Analysis
 We performed our analysis, looked at the past performance, and asked ourselves how many of those items made up the bulk of our total sales. Those were the items that we would continuously move and refresh.
But we found that one-third of our entire catalog only contributed to one-half of one percent of our entire revenue.
One-third of our catalog space, our inventory space, our management attention, our computer processing, and our sales efforts were bringing us .05 percent of our total sales.
The decision was obvious: We got rid of that one-third of our inventory. Cold turkey. We stopped selling it, we stopped offering it, and we stopped making it. If someone wanted one of those pieces, we bought them from another manufacturer. Even if we didn’t make any money on that particular item, it was worth it because we didn’t have to deal with making and storing it.
We cut a lot of costs spent chasing a few dollars.
We ended up saving $300,000 per year in parts and parts storage. And this was all straight profit because we weren’t supporting that stuff anymore.
But the savings were even larger, we just couldn’t calculate it.
The part we couldn’t calculate was the soft cost to support them: having engineers to maintain bills of material, having warehouse people shuffling the things around, and so on. We needed fewer people chasing those items around, which meant we could point them toward other work, which increased their efficiency.
A lot of companies still suffer from carrying too much inventory though. If you look at most companies’ websites today and all the things they offer, I’ll bet most of them can’t tell you which parts contribute to 80% – 95% of their revenue.
But it’s critical to know that if you don’t want to squander your working capital on storage and needless manufacturing.
I’ve been a manufacturing executive, as well as a sales and marketing professional, for a few decades. Now I help companies turn around their own business, including pivoting within their industry. If you would like more information, please visit my website and connect with me on Twitter, Facebook, or LinkedIn.
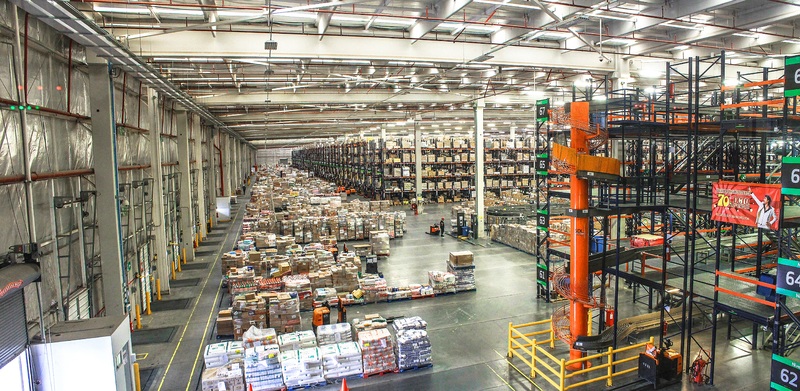
Photo credit: PXHere (Creative Commons 0)

